Telehealth Reverse Diabetes and Lower Basal Temperature | Free Trial In Texas
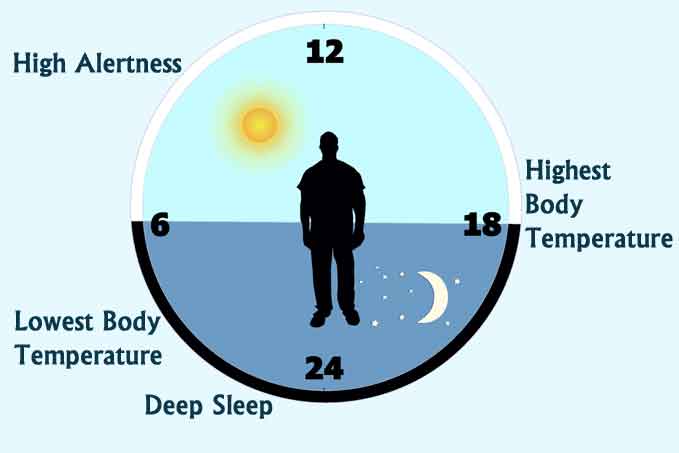
Morning Oral Temperature reflects progress clearing sugar, fat, insulin, cortisol and adrenalin from the circulation overnight. Aim for -1° F between late evening and early morning.
How? Reduce Body Fat, build Strong Muscle and get 7 hours Sleep at Night.
To learn more about the programs Herd Healthcare offers, our website is:
www.herdhealthcare.com
Basal Body Temperature
Basal is the temperature, usually oral, measured first thing in the morning. Before even getting out of bed. Before any physical activity and certainly before eating anything. Basal is to body temperature like Fasting is to blood sugar. First thing, before anything else.
There’s information in very small changes. Measurements accurate to 0.1° F really are important. Most digital thermometers display 0.1° F. They are usually pretty accurate showing differences even if they’re not completely accurate for absolute level. That’s what we need. We want to know today’s temperature compared to yesterday’s. We want to know this morning’s temp compared to last night’s. We don’t need to compare our temp to that of anybody else.
Measuring 0.1° F is a good indicator of insulin action. When there’s more sugar and fat in the blood than can be stored quickly in muscle, more and more insulin is secreted.  Insulin acts to store glucose and fatty acids in fat all over the body. It also stimulates the sympathetic nervous system to break fat into carbon dioxide and heat. If sugar and fat are still high in the blood next morning, insulin is still clearing sugar and fat and the sympathetic nervous system is producing heat.
Clearing all the excess sugar and fat from the blood can take several days or even a few weeks. It all depends on the number of calories from food eaten compared to the number of calories used in normal metabolism and physical work. Even eating nothing at all for a few days might not be enough time to create sufficient new storage sites for fat or use much glycogen to supply energy for muscle.
When excess calories from food are finally cleared from the blood, insulin falls to normal healthy levels and body temperature falls 1° or 2° F. Progress shows as a gradually increasing gap in temperature between late evening and early morning.
Basal Body Temperature is the best indicator of health related function overnight including action of insulin, cortisol, adrenalin and other humeral secretions.
Adaptive Thermogenesis
About 50% of the energy in the food we eat is transformed into chemical action or converted into mechanical work. The rest creates heat. Insulin plays an important role in enabling cellular chemical actions and stimulating the sympathetic nervous system to create heat directly. The sympathetic nervous system also controls peripheral blood flow and heat loss through the skin.
After several days of overfeeding or underfeeding, normal adjustments of heat production and heat loss extend to gaining or losing body weight. Some people have a metabolic response that acts preferentially to avoid weight loss during underfeeding while allowing weight gain during overfeeding. Others have less metabolic defense against weight loss while gaining little weight during overfeeding.
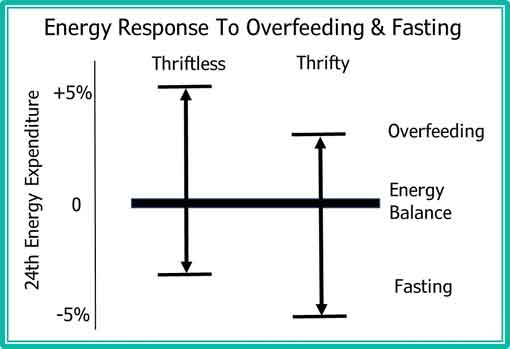 The Figure shows a Thrifty Response opposing weight loss and a Thriftless Response allowing weight loss. An individual with a Thrifty Response would likely say it’s very hard to lose weight. An individual with a Thriftless Response would find it relatively easy to lose weight.
In both categories, losing weight requires reducing calories in food and increasing physical work. Those with a Thrifty Response will lose less heat at night. Basal Body Temperature will rise and there will be less difference from Body Temperature the night before. To lose weight, everybody must reduce calories still more or keep increasing physical activity until early morning temperature becomes consistently lower than evening temperature.
Age and Core Body Temperature
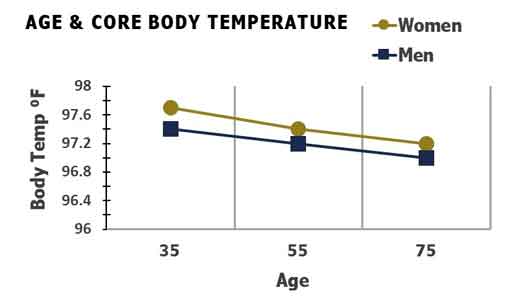 Body temperature is measured in clinical settings almost as often as body weight and blood pressure. The most common causes of elevated temperatures are acute and chronic infections. The most common causes of low body temperatures are malnutrition and conditions such as chronic renal failure or liver disease. Scarcely noticed are body temperatures anywhere between 96° and 100° F.
One thing we have noticed is that body temperature is lower in older people than younger people. We’ve also noticed that temperatures are slightly higher in women than men. The Figure shows that body temperatures of women before menopause are particularly higher than temperatures of men.
Obesity and Core Body Temperature
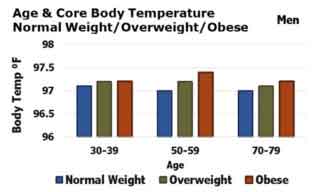 Another thing we’ve noticed about body temperature is that people with overweight/obesity have higher body temperatures. Higher than just greater weight creating more heat. This was demonstrated conclusively in the Kaiser San Diego Health Appraisal Clinic.
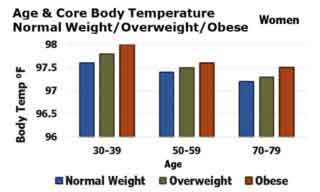 More than 18,000 men and women aged 20 to 98 years had their temperature taken using a defined protocol in a standardized health appraisal. The mean age was 58 years and the mean temperature for the whole group was 97.3° F.
As shown in both Figures, men and women, mean body temperature decreased with age. Also, obesity was associated with higher body temperatures in every age group.
We’ve also noticed that lean people live longer than overweight/obese people. The Baltimore Longitudinal Study of Aging showed that people with body temperatures in the group of 50% below the median value had a lower mortality rate during 25 years of follow-up.
All these results suggest that a lifetime of consistently low body temperature is a good sign for longevity.
Effect of Age on Range of Circadian Rhythms
We also know that body temperature changes during the day. It rises during the day and falls during the night in a roughly 24 hour cycle. This diurnal rhythm of body temperature is part of a circadian pattern that controls alertness, physical activity, hormone production and sleep as well as body temperature.
The circadian rhythms change between age groups increasing in years. Our information for human subjects comes from cross-sectional studies simply because longitudinal studies take a long time. Consequently, we don’t know whether individuals simply change with age or whether age simply is associated with some other change.
An important example is that people change their body composition as they get older. For example, fat mass increases and muscle mass decreases with age.
Whatever the reason circadian rhythms are changed with age, the most obvious is a decrease in amplitude of the differences between day and night.
The Figure shows some of the circadian rhythms observed in older adults compared to those of adults who are younger. Cortisol is a hormone secreted by the adrenal gland. It helps control metabolism, renal function and blood pressure. SCN is a Brain Nucleus which helps control cardiovascular function, respiration and body temperature. Melatonin is a hormone secreted by the pineal gland in the brain. It helps dampen neuronal activity in the brain at night.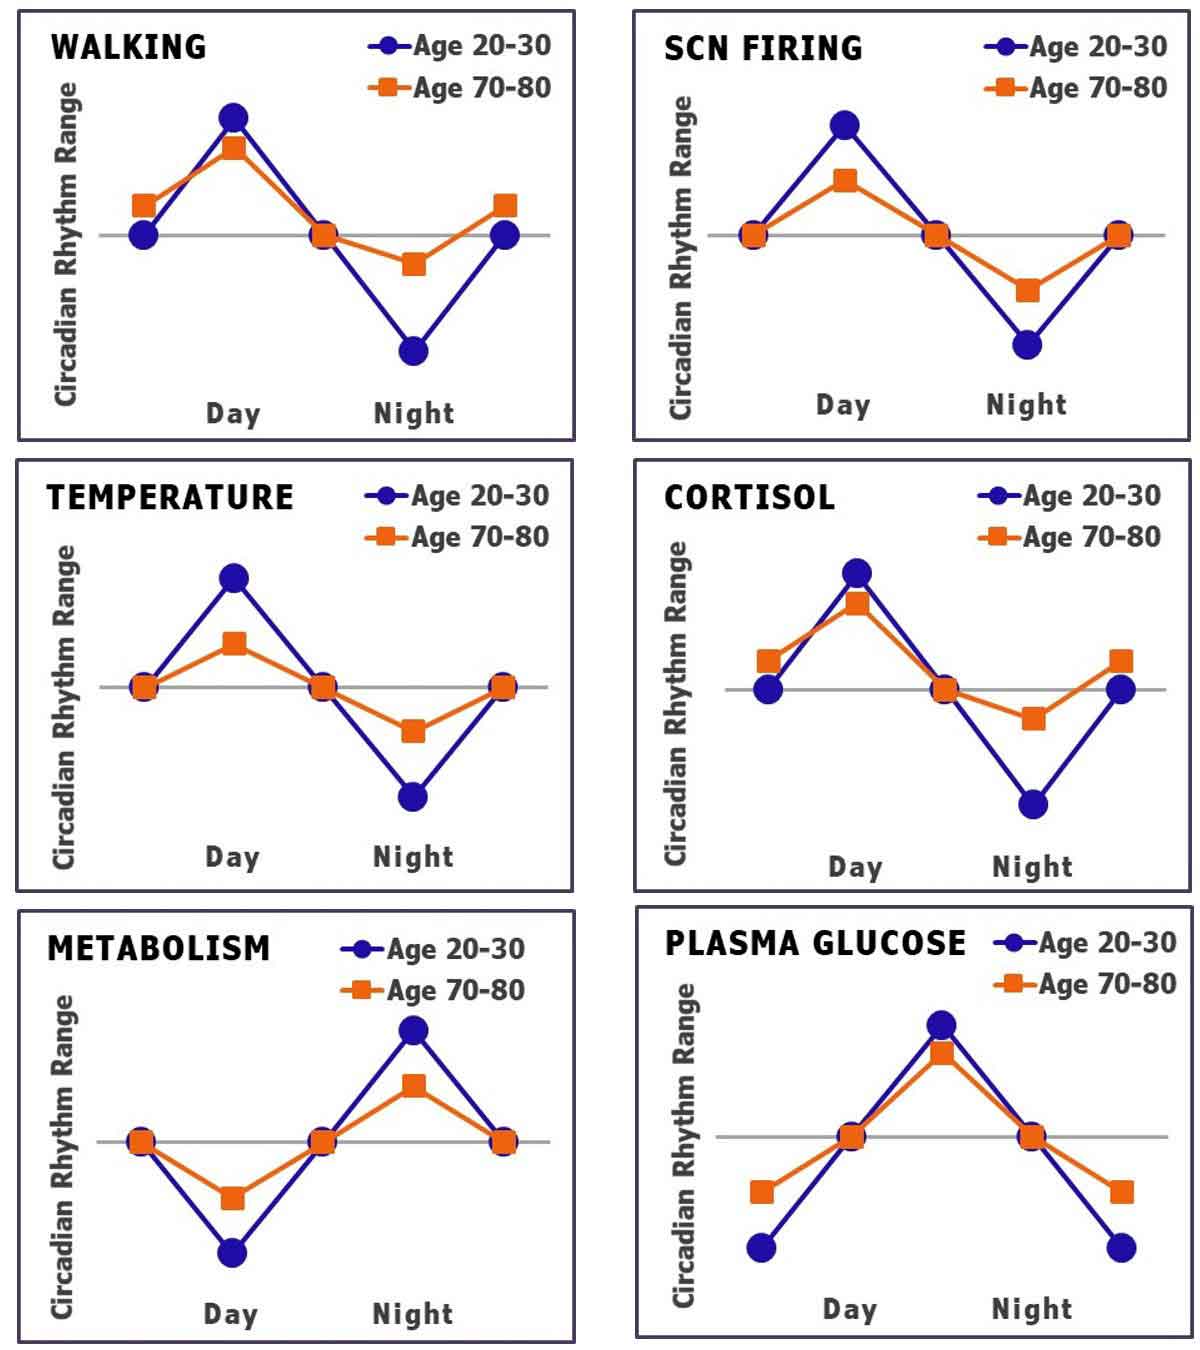
In all of these rhythms, the amplitude of change is less in older compared to younger adults.
Effect of Caloric Restriction on Energy Expenditure and Insulin
Sustained reduction of energy intake retards aging in several species. Those have been longitudinal studies. Because aging takes a lifetime, we’ve used cross-sectional studies for most of our information about aging in human subjects.
Longitudinal studies have begun. Currently, several publications have reported results from a 2-year controlled trial of human caloric restriction. Studies of 220 nonobese men and women 21 to 50 years of age were begun several years ago in 3 clinical sites located in northeastern US.
The study was designed to test feasibility, safety and effects on predictors of health after 2 years of 25% dietary caloric restriction (CR). At the end of 2 years, the test group achieved -12% CR and maintained -10% weight loss. No change 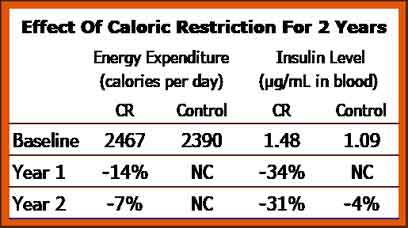 was observed in the Control group and there was little difference in core temperature in either group during 2 years.
The Table shows differences in daily energy expenditure and levels of insulin in plasma after 1 and 2 years of study. Resting metabolic rate and total daily energy expenditure declined about the same as reduction in body weight.
The most remarkable change was levels of insulin in the blood which decreased more than 30% during CR. Insulin Resistance also was markedly decreased during CR.
Other markers of risk for cardiovascular disease also improved. Mean Blood Pressure, Total Cholesterol and Triglycerides all decreased within 1 year and were sustained through the full 2 years of observation.
Future studies involving greater CR and longer duration will demonstrate whether sustained restriction of caloric intake will affect Core Body Temperature.
Cross-sectional studies of human subjects have demonstrated that age-related reductions in insulin sensitivity are likely due to an age-related increase in body fat and reduction in muscle mass.
Longitudinal studies of body temperature and body composition related to longevity in human subjects will take a long time, but they’re coming.
Summary
Basal Body Temperature (BBT) in well-nourished subjects is our best indicator of good health and longevity. Getting to the ideal BBT involves adjusting caloric intake and energy output. Gradual increase in difference between Oral Body Temperature late in the day and early in the morning is our best indicator of progress in Diabetes Reversal.
 We are pleased to share our blog articles with you, and we are always interested to hear from our readers. Our website address is: www.herdhealthcare.com


