Telehealth Reverse Diabetes And Restore Muscle Strength | Free Trial In Texas

With strong legs and narrow waist effects of age hardly count. More muscle and less fat makes better health and longer life.
Body composition changes with age but not because of it. If you don’t use it you lose it and muscle is replaced by fat.
Takes less insulin to store glycogen in muscle than triglycerides in fat. More body fat than muscle is what causes metabolic dysfunction and type 2 diabetes.
Restoring muscle strength reverses all that.
Sign Up
To learn more about the programs Herd Healthcare offers, our website is:
Body Composition And Aging
Sarcopenia is Progressive Loss of skeletal muscle mass and function. Diseases such as cancer, inflammatory bowel disease and rheumatoid arthritis can cause sarcopenia as can poor nutrition for any reason.
What sarcopenia usually refers to is age-related loss of muscle. Some investigators have suggested that aging causes deterioration of muscle and poor muscle function causes inactivity. However, most investigators say it’s more likely inactivity causes loss of muscle mass and function.
Loss of muscle mass frequently is replaced by body fat and weight may not change. That’s called sarcopenic obesity with just body strength that’s lost.
Sarcopenia not only decreases muscle performance it also affects metabolic health. Skeletal muscle has an important role in metabolic function as well as mobility. Poor health and clinical frailty cause loss of independent living and shortened life survival.
Whatever the cause of sarcopenia, correct and sufficient nutrition is essential for prevention and management of sarcopenic obesity.
Body Composition Differences are seen at different ages. Studies of individuals at different ages at any one time give evidence for possible causes of disease, disability and mortality. Age-related differences in body composition provide evidence for potential risk factors.
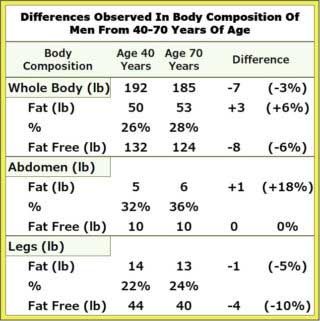 The Figure shows results of a cross-sectional study in Australia involving a random sample of 1,195 men aged 40 to 70 years. Demographic and lifestyle information was collected from questionnaires. Whole body and regional body composition were measured using x-ray technology. Fat mass, Fat free mass and Bone mass were measured.
Across a range of 30 years, there was an increase in Fat mass and a decrease in Fat free mass with little change in Total Body Weight. The principal loss in Fat free mass was a decrease in Leg Muscle mass. The principle gain in Fat mass was Subcutaneous fat everywhere else.
These differences in body composition do not tell us what caused them. Only that differences existed. Obviously, there is the possibility that differences resulted from changes in nutrition and physical activity from birth or during life.
Physical Activity And Aging
Differences in physical activity occur at different ages. Pedometer data show steps taken every day in relation to routine daily routine activity as well as exercise and sports.
Pedometer Data have been collected from men and women in the U.S. and other countries. Recently, results were reported for 1,136 individuals aged 13 years and older in the U.S.
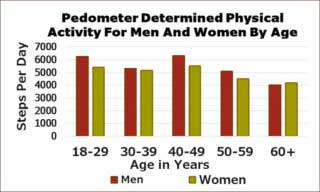 As seen in the Figure, individuals reported taking an average of 5,117 steps per day. Younger age, lower body mass index and days per week of strenuous exercise were positively associated with steps per day. Results were not associated with eating.
The investigators also reported that men and women in the U.S. took fewer steps per day than men and women in Switzerland, Australia and Japan.
Time Spent in Sports and Exercise have been collected by the American Time Use Survey. From 2003 to 2015, average daily participation rose by 3.6%. Individuals aged 15 to 24 increased their participation by 4.5%. Those older than 54 increased participation by 1.5%.
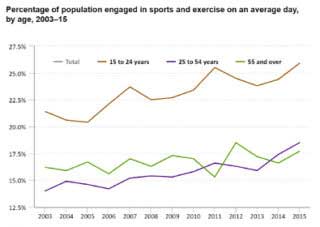 As shown in the Figure, in 2015, 26% of those 15 to 24 years engaged in sports or exercise on any one day. Only 18% of those aged 55 years and over reported participation.
Although men and women 55 years of age and over reported 18% participation on any one day, they did not do strenuous exercise.
As shown in the Figure below, those over 55 years reported mostly walking and golfing. Even there, we do not know how many walked on the golf course and how many rode a golf cart.
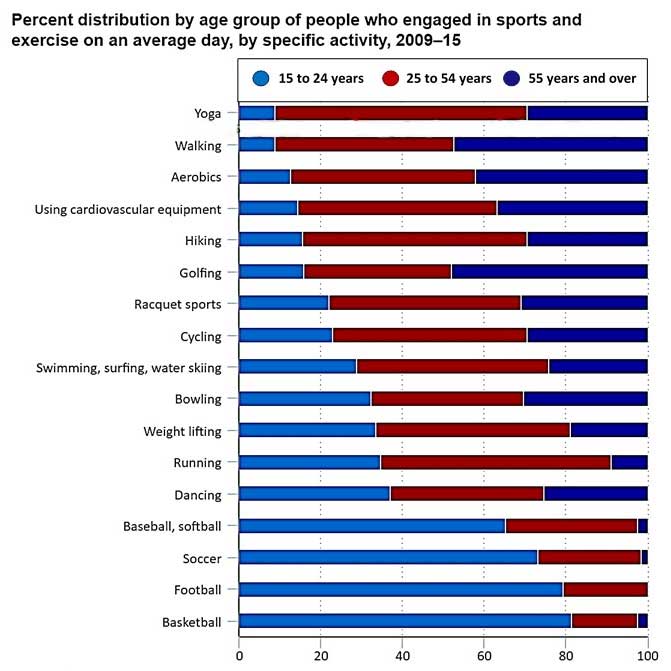
Here, again, these are cross-sectional data with each individual providing data one time in any one year. We do not even know how many provided data for more than one year.
Prospective Data have been reported for men and women in the U.S. Body weight and physical activity data for 131 individuals over 50 years of age were collected during 9 years of follow-up. Body height and weight were measured and fat volume was estimated using hydrodensitometry. Energy expenditure in sports and recreational activity was estimated from questionnaire.
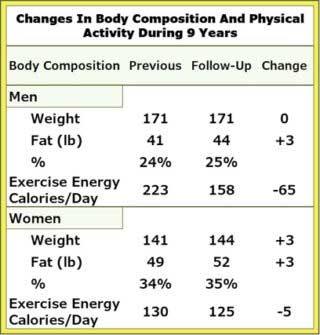 The Figure shows results obtained before and after 9 years of follow-up. Fat mass increased in both men and women while exercise energy expenditure decreased.
The investigators also reported results obtained by questionnaire. Men and women who gained weight during follow-up had less exercise expenditure baseline and follow-up than those who did not gain weight.
These results show that change in body composition with age was related at least partly to physical inactivity. One possibility is that maintaining exercise in sports and recreational activity prevented any increase in body fat. It’s also still possible that aging decreased muscle mass, decreased strength for physical activity and increased body fat.
Insulin Sensitivity And Aging
Differences in Insulin Sensitivity also are apparent at different ages. Body fat in general and intra-abdominal fat in particular are associated with insulin resistance. Differences in insulin sensitivity in relation to age and obesity have been studied in 48 young and old, lean and obese sedentary men and women in Minnesota.
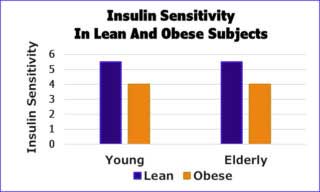 Investigators used an insulin-glucose clamp technique to measure the amounts of glucose necessary to balance increased blood levels of insulin. Young subjects were 23 years of age and elderly subjects were 69 years of age. Obese subjects at both ages had body mass index of 34 and lean subjects had body mass index of 23. Measures of physical fitness and leisure time activity were the same in all 4 groups.
The Figure shows that amounts of glucose to balance levels of insulin were the same for lean subjects in both young and elderly groups. Insulin sensitivity was less for all obese subjects compared to lean subjects. Insulin sensitivity was the same for both lean and elderly subjects.
Muscular Strength Training And Aging
Resistance Strength Training has been studied in young and elderly men and women. In general, younger subjects have more muscle mass and strength than older subjects. However, investigators have reported that men and women of all ages increase their strength with progressive resistance training.
Differences in strength and responses to training have been studied in men and women at younger and older ages in Alabama. Subjects were 49 men and women, each in 2 groups of 27 and 64 years of age. None of them was obese and none had leg resistance training in the previous 5 years.
All were trained 3 days per week for 16 weeks. Resistance training consisted of three exercises, including knee extension, leg press, and squats. Each exercise was performed for 3 sets at 8 to 12 repetitions. Resistances were increased progressively according to increase in limits of 1 Repetition Maximums.
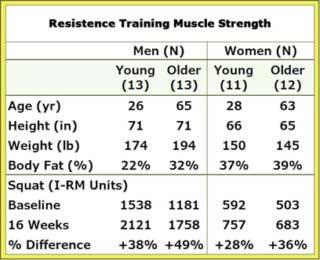 Results displayed in the Figure show that young subjects had greater strength than older subjects. Squat strength for Older men was 64% of squat strength of Young men. Squat strength for Older women was 81% of squat strength of Young women. However, strength gains among the older subjects actually exceeded the baseline strength levels recorded in young subjects.
Absolute gains in strength were about the same in young and older subjects and the % gains were greater in the older subjects. These results suggest the possibility that older subjects could retain strength of younger years by maintaining good nutrition and continuing to exercise large muscle groups.
Muscle Mass, Strength, Power And Endurance
Resistance Training improves insulin sensitivity, skeletal muscle fiber activity and cardiovascular function.
Improved skeletal muscle function increases insulin sensitivity, glucose tolerance and clearance of sugar and fat from the circulation. It improves metabolic health and reduces metabolic risk factors for heart disease, stroke, cancer, mental health and dementia.
Most evidence available supports traditional high-volume endurance aerobic exercise such as walking, running, swimming and skipping rope. The measure of physical fitness by aerobic exercise is the ability to maintain a high-volume cardiac output with high heart rate using high rates of oxygen consumption for prolonged periods of time. It involves hypertrophy of slow-twitch skeletal muscle fibers. That’s endurance training.
Much of the tradition for resistance training has been the expansion of skeletal muscle volume by heavy weight lifting or high resistance and low rate of repetitions. It develops fast-twitch fibers that drive explosive power doing low volume, heavy lifts or repetitions. That’s muscle building or muscle mass training.
The beneficial effects of strength training contributing to metabolic health involves higher volume at lower intensity. It features higher repetitions until momentary muscular failure prevents doing any more repetitions. Strength training involves 2 or 3 sets of 8 to 12 repetitions at 80% intensity followed by a final set at full intensity to momentary failure. That’s muscle strength training.
Muscle power brings in the concept of speed. Harder to measure and harder to define parameters for training. Fundamentally, muscle power is developed by strength training at faster rates of repetitions. Not more repetitions, just faster. That’s muscle power training.
Fortunately, resistance strength training is the modality most beneficial for metabolic health. It’s also the easiest to define, measure and accomplish!
Muscle Training
Good nutrition is the first principle of effective resistance strength training. The consumption of adequate protein is the first requirement. As long as normal kidney function allows it, daily intake of food should include 100 to 150 grams of protein. The distribution of calories should be about 30% starch and sugar, 40% protein and 30% fat.
Intensity of resistance is the most difficult component to define. For each exercise, you must find the intensity that allows you to accomplish 8 to 10 repetitions in 1 minute but unable to continue beyond 12 to 15 repetitions.
Estimate and test setting resistance at an intensity which allows you to do at least 10 repetitions in 1 minute but limits you to less than 20 repetitions in 2 minutes. Measure and record the maximum of repetitions, the time to reach the momentary limit and heart rate at that limit.
When you find the limit, make adjustments to accomplish no more than 12 to 15 repetitions in 1 minute. Define each exercise routine to do two 1-minute sets of 8 to 10 repetitions with 1 minute of rest between sets. Finish the exercise routine with a 3rd set to the momentary maximum limit.
Measure and record the repetitions in the 3rd set, the time to reach the momentary limit in the 3rd set, the heart rate at that limit and the heart rates at 1 and 2 minutes after stopping repetitions.
Muscle groups to be exercised include lower body, upper body and core muscles.
Lower body muscles can be exercised using squats. Intensity can be adjusted using:
•sit and stand from a chair
•free standing air squats with thighs parallel to the floor
•air squats with rear end lowered below knees
•air squats with weights (holding handles of plastic water bottles filled with water or sand)
Upper body muscles can be exercised using push-ups. Intensity can be adjusted using:
•push-away from a wall
•push-up from a bench or chair from knees or toes
•push-up from the floor from knees or toes
•push-up from the floor from toes holding full up posture for several seconds
Upper body muscles also can be exercised using planks. Intensity can be adjusted using:
•planks from elbows
•planks from straight arms
•planks held for 10 to 60 seconds or even longer
Core muscles can be exercised using crunches. Intensity can be adjusted using:
•trunk flexed up with knees bent and planted on the floor
•trunk flexed up with knees and feet lifted off the floor
•full crunch position holding that posture for several seconds
Allow 48 hours between exercises of each specific muscle group. Muscle fibers must be allowed to recover from the limiting intensity and to begin building new fibers.
Keep adjusting intensity as the maximum limit keeps increasing during repeated training sessions. Measure the improvements in strength by repeating defined exercise strength tests every 2 weeks.
Muscle Endurance and Power can be measured using a 6-min walk test. Measure and report number of steps, time from start to stop and heart rate when stopped.
Summary
Age need not bring progressive loss of skeletal muscle mass and function. It is entirely reasonable that older subjects can retain strength of their younger years by maintaining good nutrition and continuing to exercise large muscle groups.
More than strength is retained by continuing regular muscle exercise. Loss of muscle not only decreases muscle performance it also affects metabolic health. Skeletal muscle has an important role in metabolic function as well as mobility.
We can say with assurance that the appropriate balance between nutrition, endurance exercise and resistance strength training determines quality of life, performance of daily tasks and self-satisfaction. You can look good, perform well and feel great!
It also determines risk for obesity, metabolic dysfunction, type 2 diabetes, heart disease, stroke, cancer, mental health and dementia. The best $ investment for retirement is good health!
The primary concern with adopting resistance strength training is attaining maximal benefit from regular resistance exercise sessions. The most effectiveness for optimal metabolic and molecular responses to resistance training appear to come with consistent every other day training to momentary muscular maximum limits.
 We are pleased to share our blog articles with you, and we are always interested to hear from our readers. Our website address is: www.herdhealthcare.com


