Telehealth Reverse Diabetes With Resistance Strength Training
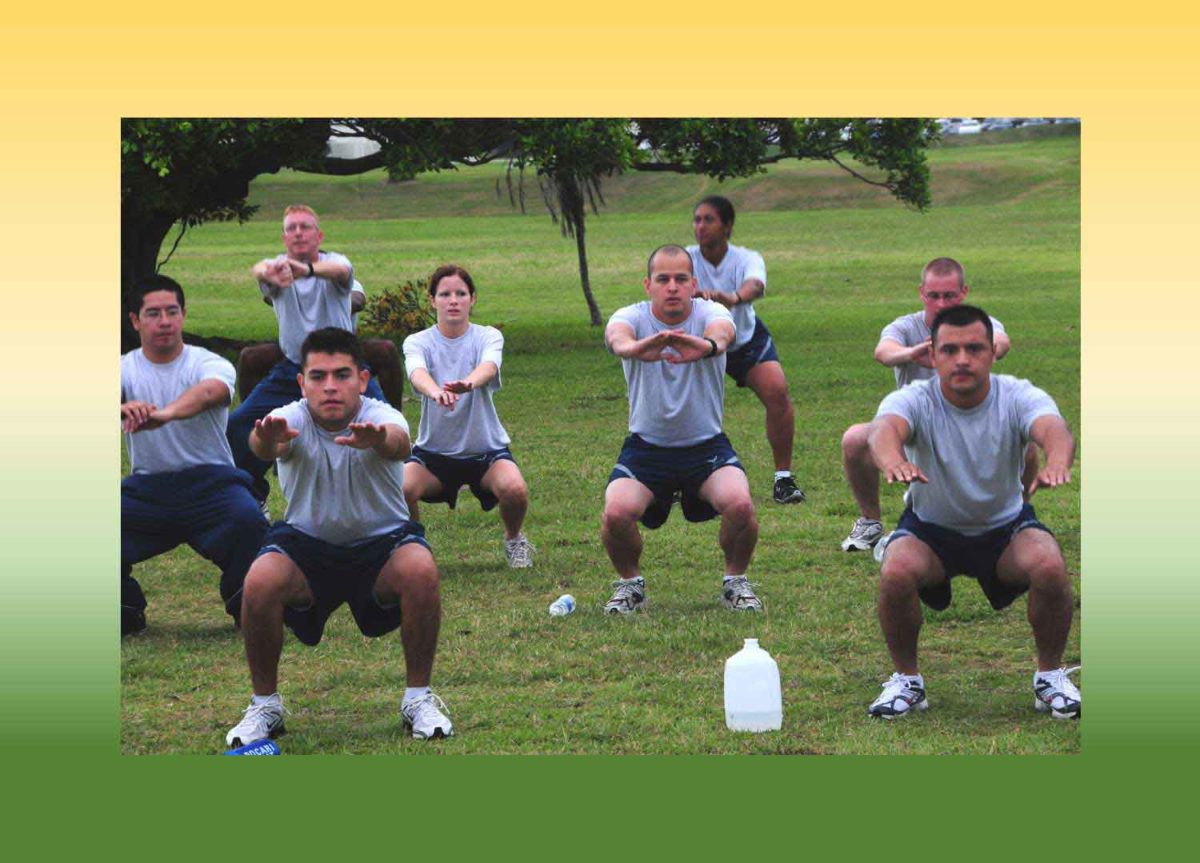
Underfeeding in Type 2 diabetes just reduces metabolic rate. That blocks weight loss. Reducing weight requires building more muscle and burning more calories. That requires resistance strength training.
Reversing diabetes requires clearing all the excess calories still left in the circulation every day. The energy we take in and the energy we use vary a lot from time to time and person to person.
To learn more about the programs Herd Healthcare offers, our website is:
www.herdhealthcare.com
Metabolic Efficiency
About 60% of the energy we take in each day is used for basic cell structure and function. The other 40% includes digestion, physical activity and non-exercise activity.
About half of energy used everywhere is converted into chemical, electrical and mechanical work. The rest of it turns into carbon dioxide and heat.
These are very general estimates. Energy efficiency depends on epigenetic influence of gene expression. It could be half as much more or half as much less depending on the efficiency of cellular metabolism.
As a result, anything less than about 50% reduction of total energy intake can be managed without losing body weight.
Managing Body Composition
Body Fat Percentage greater than 25% for men and 35% for women increases risk for cardiovascular disease, stroke, cancer and dementia. Ultimately, we would like to help reduce body weight in everyone with overweight/obesity.
Anyone with BMI >25 has a 30% risk for Type 2 Diabetes and BMI >30 carries a 60% risk. However, strategy for reducing body weight in people without diabetes must be different than for reducing weight in people with diabetes.
• People without diabetes respond to reducing total calorie intake with a reduction in Body Weight without much change in Total Energy Expenditure.
• People with diabetes respond to reducing total calorie intake with a reduction in Total Energy Expenditure without much change in Body Weight.
There is a difference in body composition for people with and without Type 2 Diabetes.
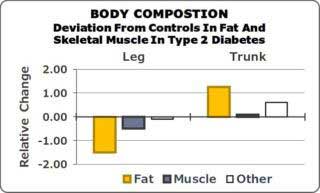 The body composition for 1,315 men and women from the Look AHEAD research group in the U.S. was compared to a matched control group of 242 men and women. The Figure shows substantially greater Trunk Fat Tissue and lesser Leg Muscle Tissue in subjects with Type 2 Diabetes.
Other studies of 2,675 older adults in the U.S. showed that subjects who developed type 2 diabetes during a follow-up period of 6 years lost more leg muscle mass than those without diabetes.
Apparently leg skeletal muscle mass protects against type 2 diabetes.
Effects Of Exercise On Resting Metabolic Rate
Metabolic Rate gets slower as you get older. It’s hard to say that age is the cause. It’s more likely what happens to Fat and Muscle along the way. Body fat gradually increases and skeletal muscle decreases. If changes in body composition are reversed, Resting Metabolic Rate returns to what it was earlier in life.
Reversing loss of skeletal muscle reverses effects on Metabolic Rate. Skeletal Muscle has higher Resting Metabolic Rate than Fat. It also takes energy to build it. Even more important, skeletal muscle stores sugar in glycogen and fatty acids in fat molecules to supply energy for muscle contraction. At the end of the day, skeletal muscle stores of energy are refilled without much need for insulin. Consequently, skeletal muscle uses a lot of energy and insulin clears a lot of sugar and fat from the blood.
Building skeletal muscle requires energy, mechanical work uses energy and refilling glycogen and fat stores keeps clearing sugar and fat from blood during rest.
Increasing the effectiveness of insulin also moves fat from adipose tissue into skeletal muscle for mechanical work every day.
Effects of resistance strength training on Metabolism in older age men and women were studied in Alabama. Subjects were 15 men and women 61 to 77 years old in a 26-week resistance training program. Each subject trained for 45 minutes at 300 kcal/hour on 3 days each week. Body weight did not change but % Body Fat decreased by -12% and Fat Free Mass increased by +2%.
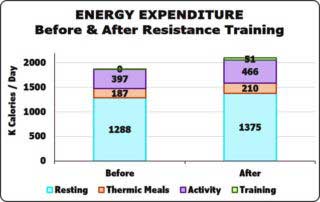 Energy expenditure all day was compared before and after the training began and was compared. As shown in the Figure, all components of Energy Expenditure increased. This included an increase in Resting Metabolic Rate as well as an increase in Activity-Related Rate.
Muscle Strength also increased. Upper Body Strength increased by +25% and Lower Body Strength increased by +42%.
Results of metabolic studies by several other investigators have shown that Resistance Strength Training causes a substantial decrease in insulin resistance.
Intervention To Increase Metabolic Rate During Caloric Restriction
Assessment of Metabolic Function, Medication, Nutrition, Physical Activity and Sleep. In particular, it is important to assess history of attempts to manage blood sugar, body weight and physical activity. It is particularly important to assess cardiovascular, renal and skeletomuscular function.
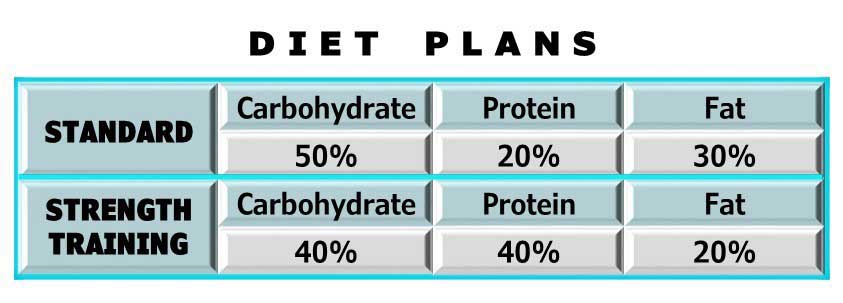
Nutrition must be adjusted for distribution of calories between carbohydrates, proteins and fats. Resistance Strength Training requires increasing protein intake to about 150 grams per day.
Achieve steady state of function for observations and measurements of baseline function. Must be certain that body weight, metabolic function and physical activity are not changing for a week or two.
Baseline Testing of Muscle Strength, Blood Sugar, Oral Body Temperature and Heart Rate.
Check that Blood Sugar level is between 100 and 250 mg/dL before Exercise of Medium or Strenuous Intensity. Medium Intensity causes deep breathing while still able to talk in short sentences.
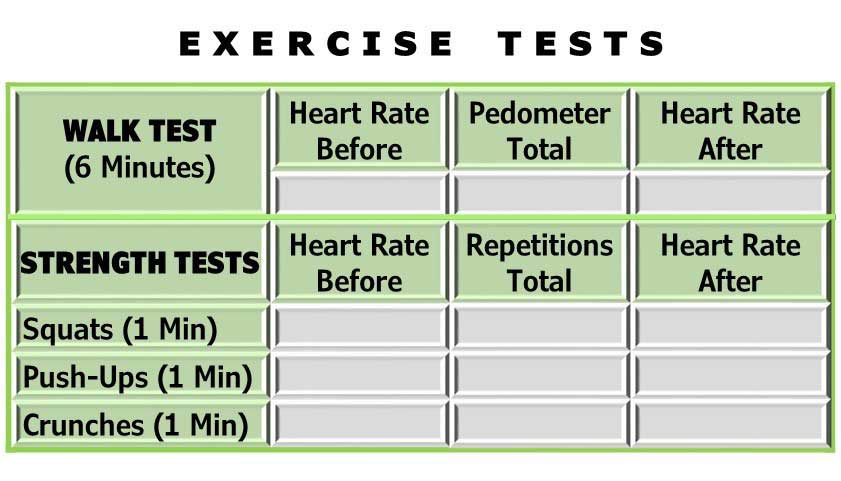
•Walking Tolerance Test: Use a pedometer to record the total number of steps taken while walking as fast as possible for 6 minutes. Measure Heart Rate before and immediately after Fast Walk for 6 minutes.
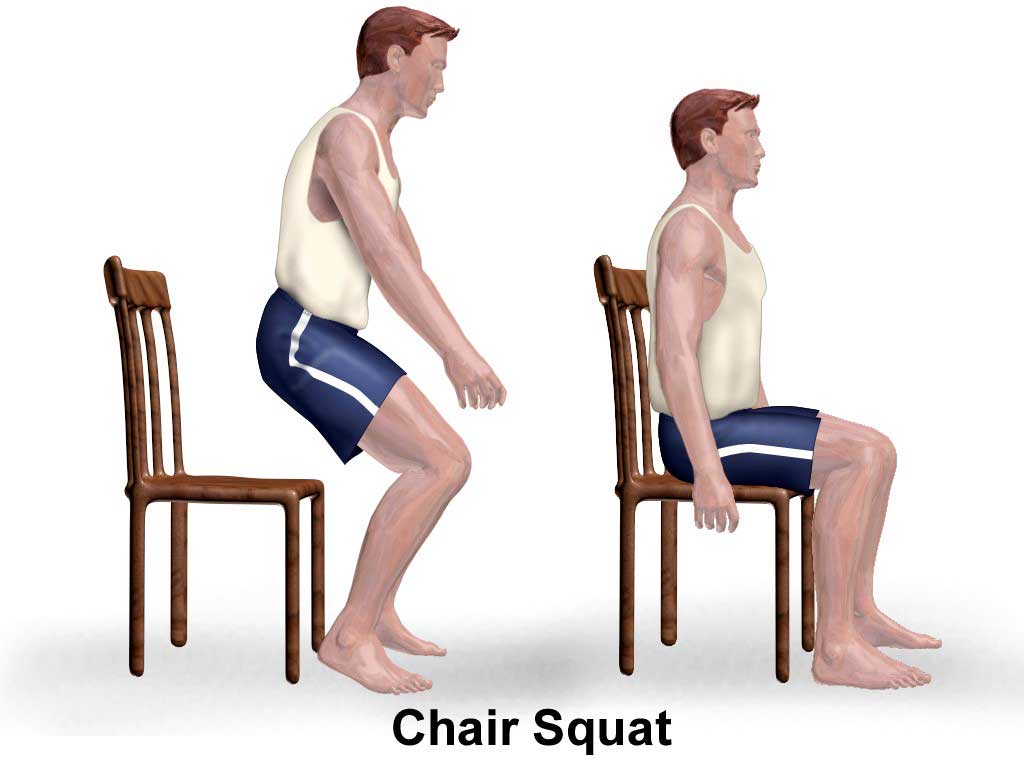
•Lower Body Strength Test: Use a chair the same height as the lower leg (thigh parallel to the floor) to sit and stand up repeatedly, arms out in front as many times as possible in 1 minute. Measure Heart Rate before and immediately after 1 minute of Squat Strength Testing.
•Upper Body Strength Test: Use a mat on the floor to place hands and toes or knees on the floor. Straighten arms and lift shoulders until the body is straight. Lift up and down as many times as possible in 1 minute. Measure Heart Rate before and immediately after 1 minute of Push-up Strength Testing.

•Core Neck, Shoulders and Back Muscles Test: Use a mat on the floor to lie flat on the back. Bring head, neck, shoulders and feet up and down from the mat as many times as possible in 1 minute. Measure Heart Rate before and immediately after 1 minute of Crunches Strength Testing.

Exercise Schedule for Fast Walking and Resistance Strength Training. The more the better! Both Intensity and Duration really matter. Both can be judged by measuring your Heart Rate (HR) and your Oral Body Temperature (OBT). Check the schedule for safety by measuring Blood Glucose (BG) before and after Exercise.
Judge Intensity and Duration for regular exercise to be the effort required to bring HR 20 beats/minute less than the HR measured after the most recent Exercise Test.
•Fast Walking: Total Duration of 150 minutes per week in sessions each at least 10 minutes in Duration. Measure HR after each session at least 10 minutes in duration. Measure OBT and BG before and after any Fast Walking session at least 30 continuous minutes in duration.
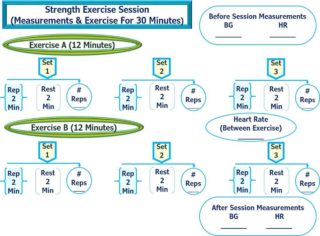
•Resistance Strength Exercises: Total Duration 90 minutes per week on at least 3 days. Each session at least 30 minutes for 2 types of Exercise. Don’t repeat the same type of exercise 2 days in a row. Measure HR before and after each type of Exercise. Measure OBT and BG before and after 30 continuous minutes doing 2 types of Resistance Strength Exercise.
Above All, Enjoy Yourself!
 Periodic Testing for Improvement in Endurance Tolerance for Fast Walking and Strength Tolerance for Resistance Muscle Exercises.
•Fast Walking: Test and Retest once each week and revise criteria for Intensity and Duration according to results of Retesting.
•Resistance Strength Exercises: Test and Retest once each week and revise criteria for Intensity and Duration according to results of Retesting.
Summary
Type 2 Diabetes with Overweight/Obesity and Overweight/Obesity without Diabetes respond differently to Caloric Restriction.
Regular Aerobic Endurance Training and Resistance Strength Training are important Interventions with both types of Overweight/Obesity.
There are important differences in Metabolic Response to Caloric Restriction and Exercise. Measurements of Fasting Blood Sugar, Body Weight, Heart Rate and Oral Temperature guide Intervention Strategy.
Type 2 Diabetes with Overweight/Obesity:
Expect Decrease in Autonomic Nervous System Activity
•No Change in Body Weight or Fasting Blood Sugar
•Decreased Core Body Temperature both late evening and early morning
•Decreased Heart Rate in late evening, no change in early morning
Intervention Emphasis on Resistance Strength Training.
Overweight/Obesity without Diabetes:
Expect Increase in Autonomic Nervous System Activity
•Decreased Body Weight and Decrease in Fasting Blood Sugar
•No Change Core Body Temperature both late evening and early morning
•Increased Heart Rate in late evening, no change in early morning
Intervention Emphasis on Endurance Aerobic Training
Check Blood Glucose before and after Medium or Strenuous Exercise. Be sure that levels are between 100 and 250 mg/dL before starting an Exercise Test or an Exercise Session.
 We are pleased to share our blog articles with you, and we are always interested to hear from our readers. Our website address is: www.herdhealthcare.com


